|
Measuring – Display and Administrate Curves
|   |
Display and Administrative Curves:
After the measurement is completed, it is possible to add comments to the curves in the file. It is also possible to show, hide, or delete curves. Further information about the measuring conditions and special single values can be added.
Edit Mode:
|
Figure 26: ACAM screen showing curves |
|
Status Bar Displays Examples:
|
Figure 27a: Status bar showing the mouse cursor located on the coordinates 2443 Hz and 87 dB in the frequency diagram. |
|
Figure 27b: Status bar showing the mouse cursor located on the coordinates 68 dB and 73 dB in the I/O diagram. |
|
Figure 27c: Status bar showing mouse cursor located over a curve; a series of further information is displayed. Curve #1: input level of 60 dB and mouse cursor coordinates. |
|
Figure 27d: If the mouse cursor remains over a curve for approximately 1 second, a small help window appears providing additional information about this curve. Figure 27d shows: curve number, curve type, date, time, and corresponding curve comment. |
|
Figure 27e: In the setup menu, curves can be labeled or named with basic measuring parameter information (Example: Label real ear measurement curves as REAR, REUR, etc.) |
Curve info window:
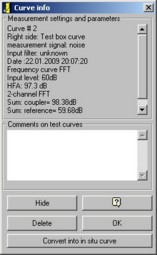
To obtain detailed information about a curve, open the Curve info window by clicking the right mouse key (Figure 28).
The Curve info window displays saved information for each curve. Additional comments for each test curve may be added in this window.
If an RECD has been measured for one of the ears, the options to <Convert into in situ curve> or <Convert into test box curve> will be available.

Figure 28: Curve information with conversion button
Curve Display Options:
Selected curves can be edited by clicking: <insert>, <hide>, or <delete>. Target information may also be shown or hidden.
For further information, please refer to the section: "Save Window."
Curve display options may be changed using the setup menu. It is possible to switch between the output level (dB SPL) axis and the gain level (output - input) axis, line width, and more.
The display of the measurement range (i.e. the scale division of the y-axis) can be adjusted. It is possible to display levels from less than 30 dB to greater than 140 dB.
The i/o diagram is typically displayed for input levels from 30 dB to 100 dB.
For further information, please refer to the section: "Setup."
Right-Click options (Figure 29):
Right-click the mouse anywhere on the test box screen to open a window that allows you to show, hide or delete curves.
Curves may also be exported into various formats.
|
|
Figure 29: Right-click options
Attack and Release Times:
It is possible to zoom in on the displayed curve for the attack and release time measurements.
Save Dialog (Figure 30):
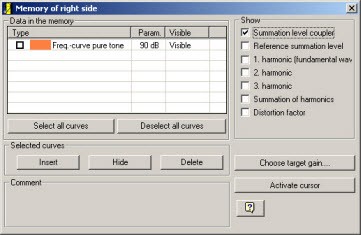
If you have measured curves with pure tones you may overlay additional curves for comparison on the same screen.

Figure 30: Memory of right side
Descriptions of Items which can be displayed in the Save Dialog window:
|
Item |
Description |
|
Summation Level Coupler |
The total level measured using the coupler is displayed. This is the unweighted and unfiltered RMS value. |
|
Reference Summation Level |
The (unweighted) total level measured via control or reference microphone is displayed. If the system is correctly calibrated, this should show a flat line for the selected input level. |
|
1. Harmonic |
The value corresponding to the input frequency using the FFT only is displayed. For 1000 Hz, this is the level from 993.5 Hz to 1006.5 Hz. The value can be below the total level if interfering noise is present or when the hearing instrument produces distortion. |
|
2. Harmonic |
Using the FFT the second harmonic (i.e. 2x stimulus frequency) is displayed. |
|
3. Harmonic |
Using the FFT the third harmonic (i.e. 2x stimulus frequency) is displayed. |
|
Summation of Harmonics |
All harmonics (except the first one) are added and displayed. |
|
Distortion Factor |
Total harmonic distortion (ratio of the total harmonics to the first harmonic, harmonic in %) is displayed. In the right corner, an additional scale is shown (0-100%) that applies to these distortions. |
Measure tab mouse functions:
In the Measure tab (test box/ real ear) the left and the right mouse keys have functions.
|
Action |
Effect |
|
Double click on the screen background |
Opens the edit saving dialog |
|
Click on curve using left mouse key |
Opens curve information dialog |
|
Click on curve using right mouse key |
Opens menu curve delete / hide / convert |
|
Right click on screen background |
Opens all curves hide /show dialog |
|
Mouse is in the active (yellow) field |
Coordinates are shown in the status fields |
|
Mouse is over a curve |
Curve information and short information are displayed |
|
Middle mouse key held down |
Zoom window pull out (only in sound design and the control time measurement). |