|
Measuring - Percentile Analysis
|   |
Percentile Analysis:
|
|
Click <perc> to enable the percentile analysis. |
|
|
Click <go> or press the Enter key to start the actual measurement. Click <go> again or press the ESC key to interrupt or cancel the measurement. |
|
Figure 62: Percentile analysis option window |
Selection window options (Figure 62):
The measurement will appear on the screen after it is completed. Selected curves can be edited by clicking: <insert>, <hide>, or <delete>. For further information, please refer to the section: "Display and administrate curves." |
Various display modes in the percentile analysis:
Settings for the display modes are located in the Presentation tab.
|
Figure 63a: 3 values model |
Figure 63b: 3 values model |
|
Figure 64a: 4 values model |
Figure 64b: 4 values model |
|
Figure 65a: 5 values model |
|
|
Figure 66a: Display of diagram targets, dynamic compression rates (CR), and the target curve transformation |
Figure 66b: Display of the diagram targets (red), the dynamic CR (numerical values at the percentile bars) and the target curve transformation (black line). |
|
Figure 67a: Display at lines |
|
Percentile analysis measuring options:

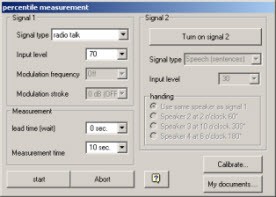
Figure 68: Percentile analysis window
Table refers to Figure 68.
|
Setting |
Description |
|
Signal Type |
|
|
Input Level |
|
|
Modulation Frequency and Modulation Depth |
|
|
Lead Time |
|
|
Measuring Time |
|
|
Enable Signal 2 |
|
|
Signal 2 – Signal Type |
|
|
Signal 2 – Level |
|
|
Signal 2 to Loudspeaker |
|
|
Start |
|
|
Abort |
|
Calibration of percentile analysis:
To determine if calibration is necessary, observe the total level of the reference micrphone during the calibration meaurement (Figure 69). This value should match the level adjusted by the user. If this is not correct, calibration should be performed of the signals that are being used. Otherwise, it will take 15 minutes to calibrate all available signals.

Figure 69: Calibrating the percentile analysis
Selection of the signals for calibration:
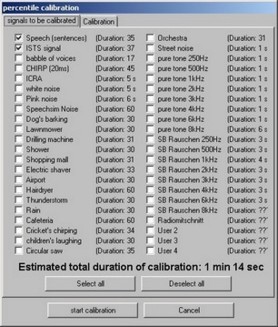
The ACAM System estimates the amount of time necessary for calibration and displays an approximate value. Figure 70 shows an estimated time of 1 minute.
In this window, you can click on the box to select and deselect signals to be calibrated. Click the <start calibration> button to begin the calibration.

Figure 71: Selection of signals for calibration
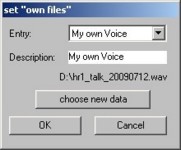
Own Files:

Figure 72: Own Files window
Adjustments in Setup:
The measuring accuracy/measuring speed of the percentile analysis can be adjusted in the setup window of the Measure tab.
Select from the following resolutions:
|
Resolution |
Number of measuring points (Defaults) |
|
Very good |
500 Measurements |
|
Good |
200 Measurements |
|
Medium |
100 Measurements |
|
Fast |
40 Measurements |
|
Very fast |
20 Measurements |
Note: